Health Monitoring

Catch Health Issues Before They Cost You

Location-aware monitoring helps you spot lameness, mastitis, and illness earlier - saving you vet bills and lost production
Explore Health Monitoring
The Problem

By the Time You See Symptoms, It's Already Costing You

Sick cows cost you in vet bills, lost production, and longer recovery times. The earlier you catch issues, the better the outcome.

But you can't be everywhere at once, and by the time visual symptoms show up, the problem has often been brewing for days.

"Dairy assistants get it wrong, herd managers get it wrong, even I get it wrong, but the cows don’t lie."
— Waikato, Early Adopter
The ProTag Solution

Get Alerts Before Problems Become Obvious

ProTag monitors activity and location together — giving you early warning signs when cows show abnormal behaviour.

Low activity in the paddock? Potential lameness. Spending less time at the feed pad? Could be mastitis or illness. ProTag spots the patterns you can't see.

The ProTag App

Individual Cow Health Monitoring

Track every cow's vital behaviours in real-time. Spot deviations from normal patterns and catch health issues before they become serious problems.

Daily Health Snapshot

Daily Vitals at a Glance

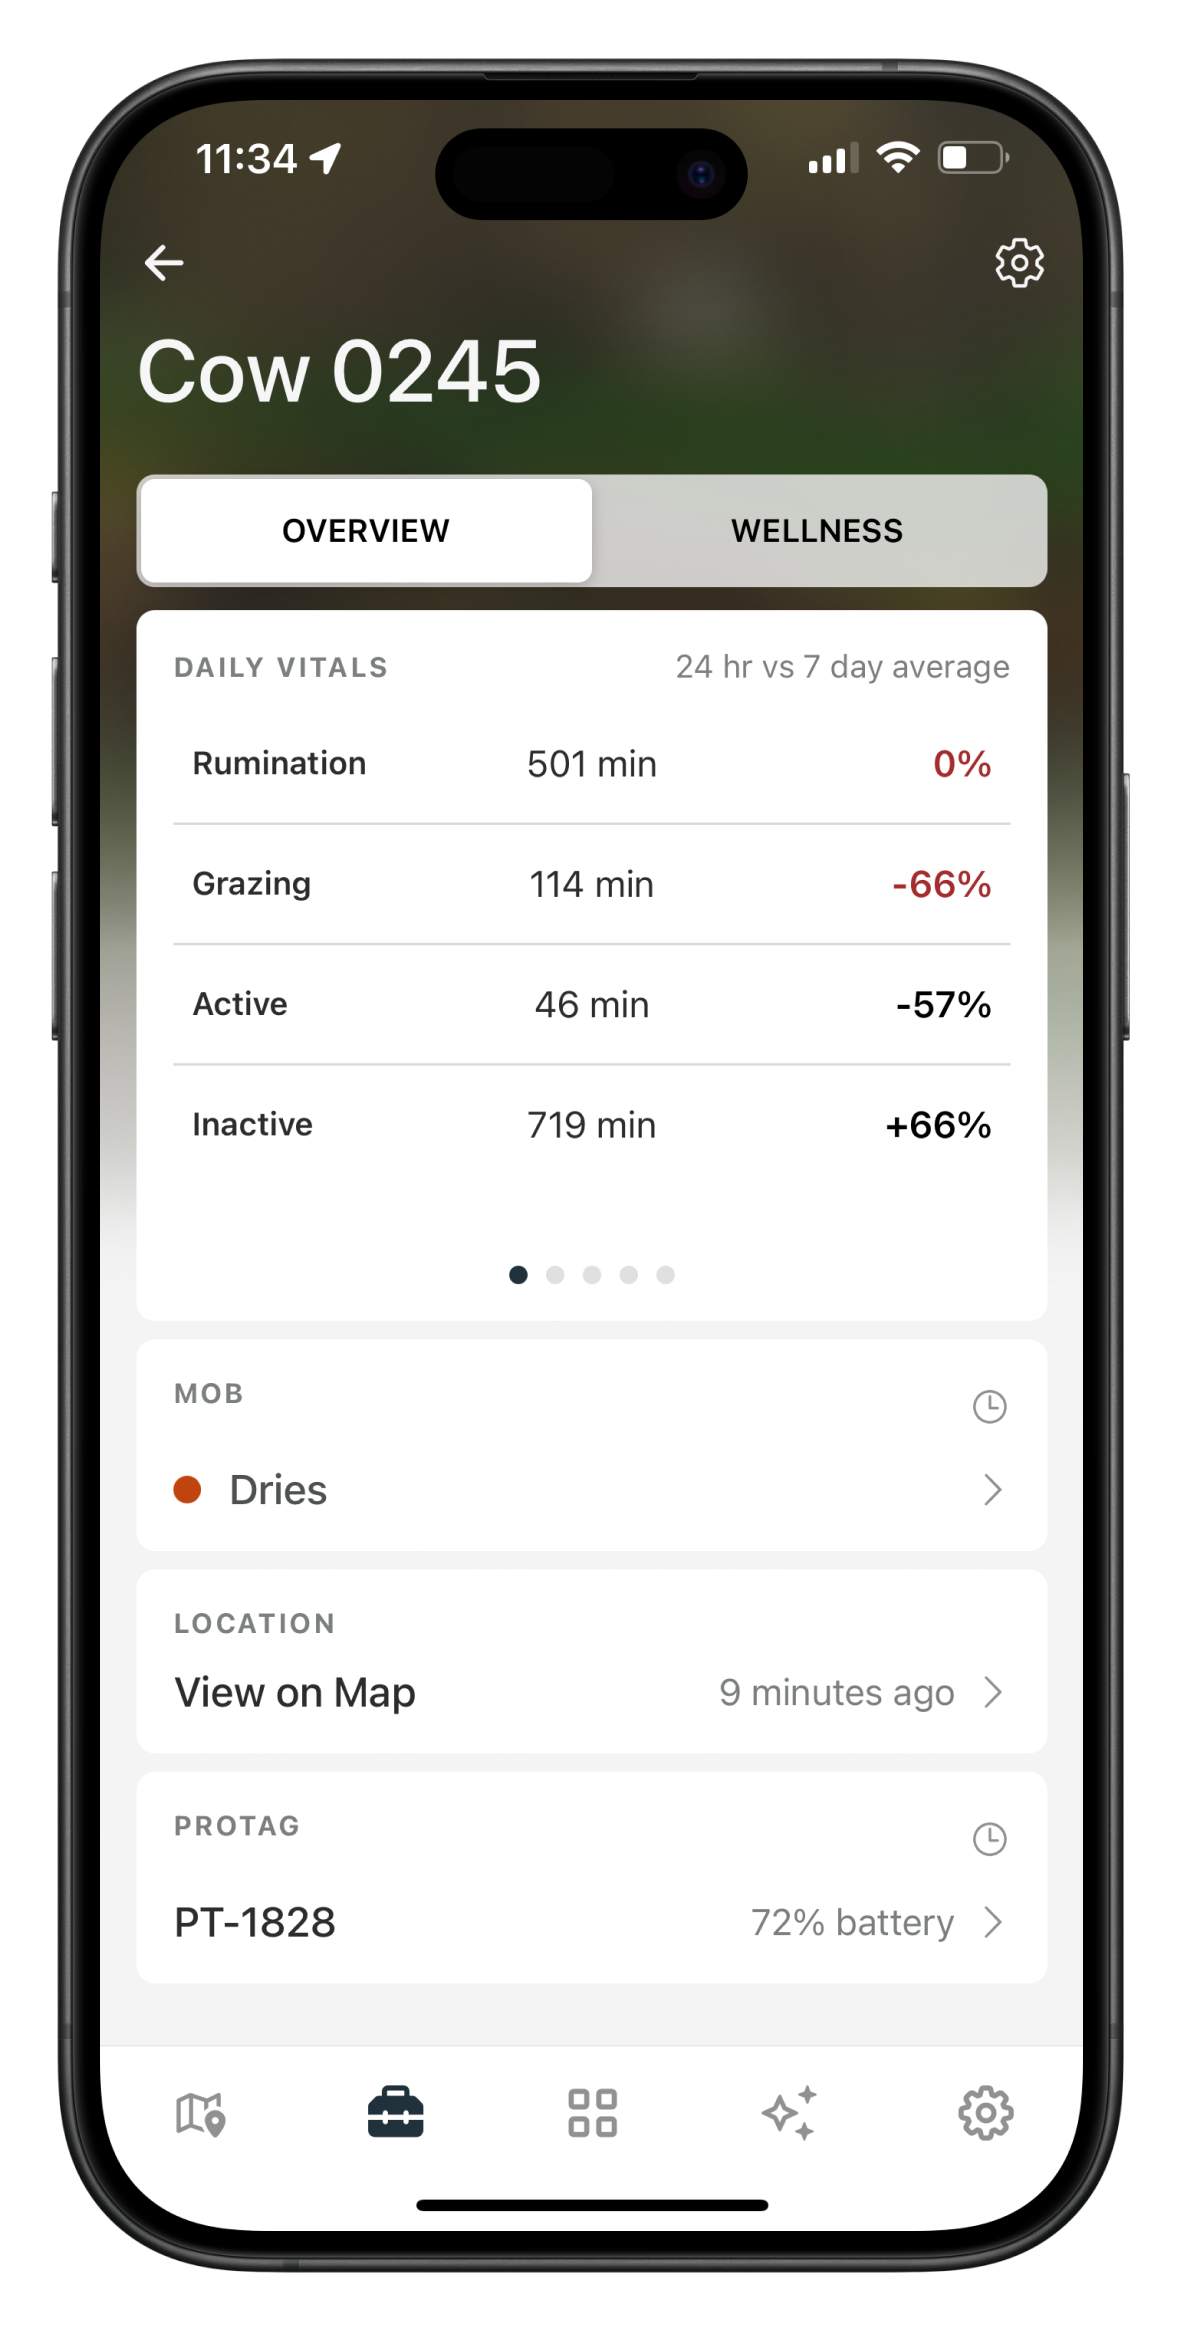
See each cow's key health metrics compared to their seven day average. Significant changes are highlighted in red — making it easy to identify cows that need attention.

24hr vs 7-Day Average Comparison
Monitor rumination, grazing, active, and inactive periods to quickly identify deviations from the norm
Automatic Deviation Alerts
Receive alerts when there are significant changes in cow behaviour, helping you address potential health issues promptly
Complete Cow Context
Easily access the history of mob and tag assignments, quickly locate cows on the map, all at your fingertips
Weekly Patterns

Track Patterns Over Time

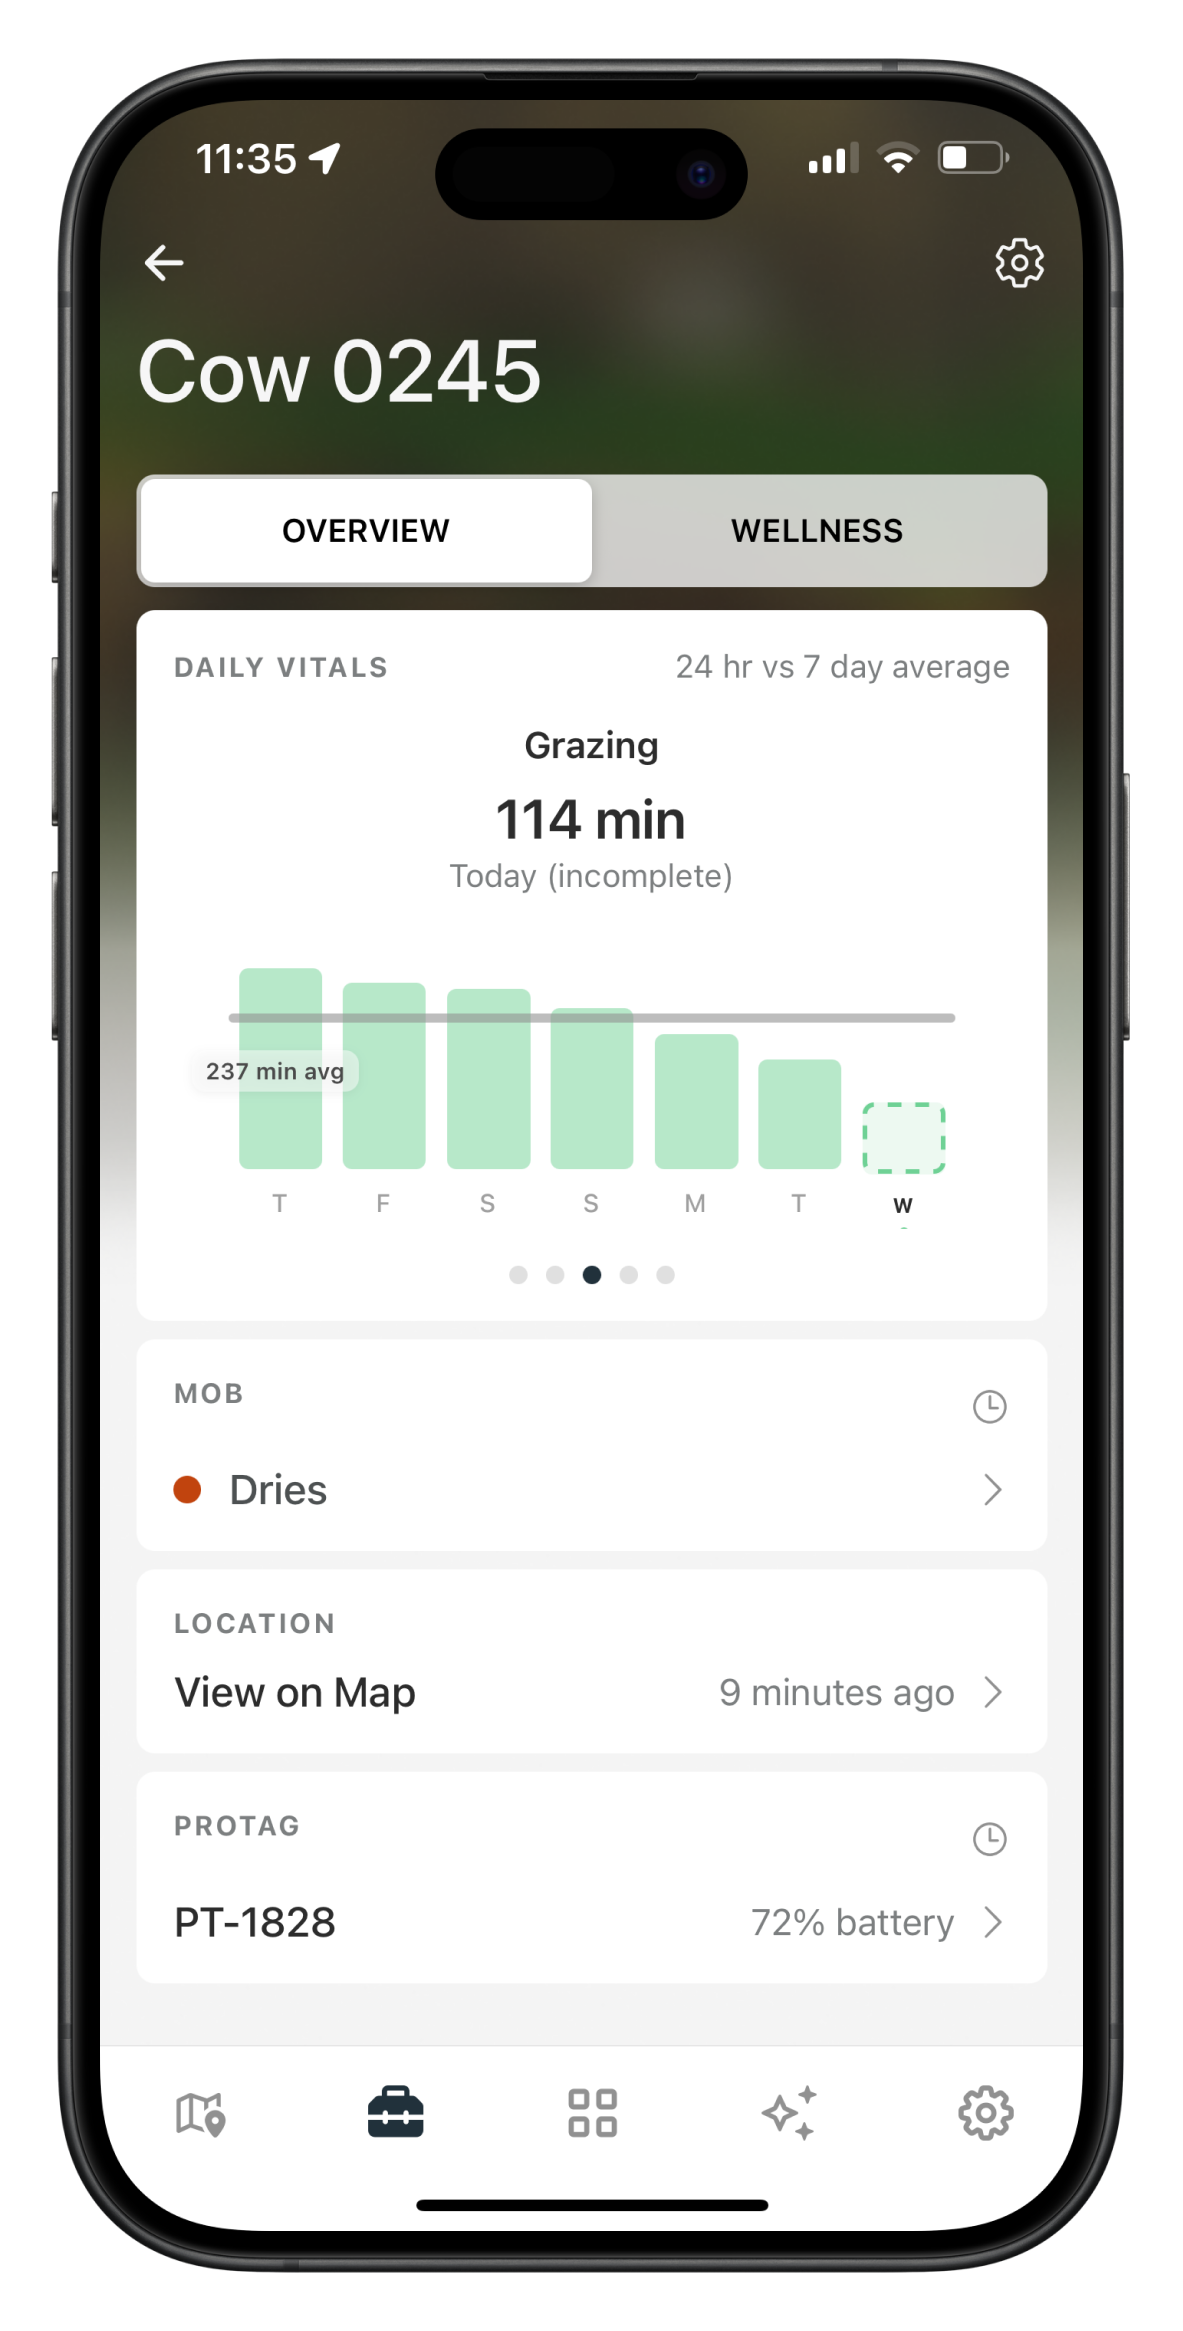
Dive deeper into any metric to see weekly trends. Understand if today's low grazing time is an anomaly or part of a declining pattern that signals a developing health issue.

Daily Bar Charts
See each day's accumulated behaviour compared to the weekly average
Identify Declining Trends
Spot gradual declines in activity that indicate developing health problems
Track Recovery Progress
Monitor sick cows and see their behaviour return to normal after treatment
Long-Term Analysis

Multi-Week Wellness Trends

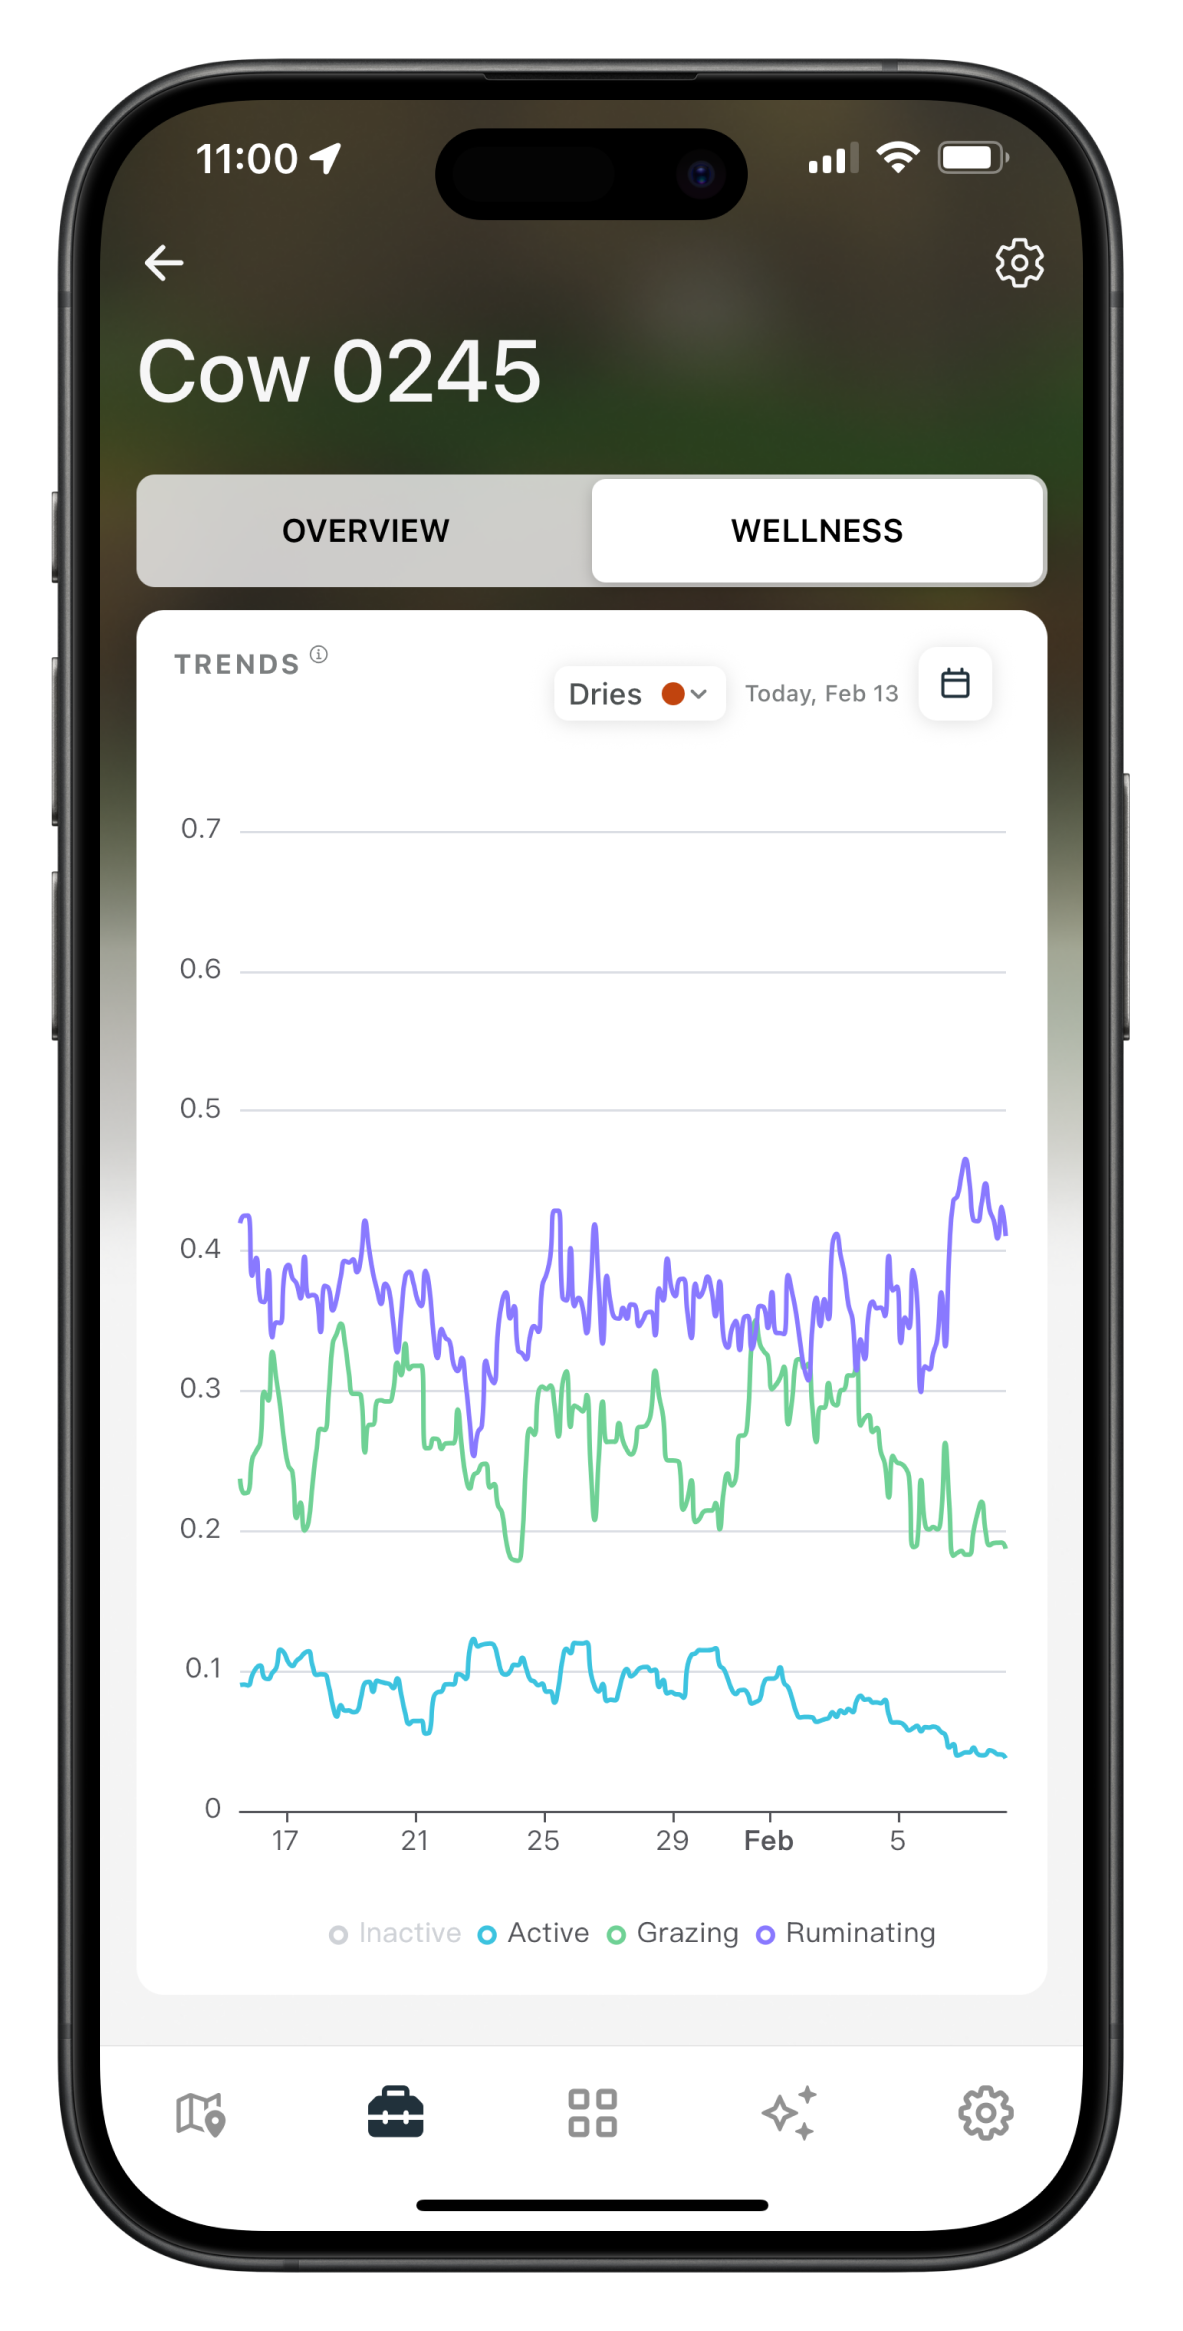
The Wellness tab shows all four key metrics on one graph over multiple weeks. See how Inactive, Active, Grazing, and Ruminating behaviours interact and change together.

Four Metrics, One View
Inactive (orange), Active (blue), Grazing (green), and Ruminating (purple) are displayed together, providing a comprehensive view of each cow's behaviour
Compare to Mob Level Aggregates
Easily compare individual cow behaviours to the overall herd trends, allowing you to quickly identify any deviations that may indicate health issues
Historical Context
Understand how today's behaviour compares to weeks of historical data